

Water Park Capacity Planning

Most water park business plans treat visitor numbers as a marketing variable—the assumption being that increased marketing investment will drive more ticket sales and consequently have the higher attendance. In reality, however, visitor numbers are a function of engineering design. On any given day, the number of guests a park can accommodate is constrained by the capacity of its site, aquatic facilities, and attractions. A park’s operational performance is determined not by its total annual attendance, but by the conditions during peak hours on its busiest days.
This capacity is determined years in advance, during the design and blueprint phase. The height of slide towers, the width of stairways, the dimensions of splash pools, the ratio of high-thrill attractions to family-oriented ones, and the number of changing rooms—all of these are decisions that dictate capacity. These choices are locked in during the capital expenditure phase and continue to shape day-to-day operations long thereafter. If these decisions are flawed, the resulting issues—such as excessive wait times, poor guest reviews, or the need to rely on deep discounts to drive traffic—may appear to be marketing problems, but at their core, they are fundamentally issues of arithmetic.
In the following sections, we will explore the mechanics of how water park capacity functions.
Part Ⅰ: The Five Capacity Dimensions
A park’s capacity is not determined by a single figure, rather, it is constrained by five distinct dimensions. The maximum daily attendance is dictated by whichever of these dimensions reaches its limit first.
Infrastructure Capacity: This encompasses parking spaces, entryways, ticket counters, lockers, changing facilities, and restrooms. For most water parks, this is the first constraint to reach saturation—a factor frequently overlooked during commercial planning.
Water System Capacity: This relates to the safe occupancy limits of pools, water filtration and circulation cycles, chemical treatment plan, and the capacity to replenish fresh water. These constraints are dictated by both engineering requirements and regulatory compliance standards.
Attraction Capacity: This refers to the hourly throughput of various slides, the simultaneous occupancy limits for rides, and the safe capacity thresholds for areas such as wave pools.
Service Facility Capacity: This covers food and beverage outlets, rental items like swimming rings and cabanas, retail shops, and on-site first-aid services. Queuing for these services consumes a guest’s time just as much as waiting in line for a water slide.
Staffing Capacity: This includes lifeguards, ride attendants, custodial staff, and maintenance teams. Regardless of an attraction’s designed capacity, it must remain closed if qualified personnel are not present to operate it.
A core limiting factor refers to a resource bottleneck that reaches saturation first, thereby capping the park’s overall attendance. If changing rooms reach capacity by 11:30 AM, or if the parking lot is full by midday—forcing the park to turn guests away—then adding a flagship slide will do nothing to increase the park’s actual capacity. Investing capital into areas that are not bottlenecks serves only to increase depreciation costs without yielding any operational benefits.
A highly diagnostic question to ask is: on a projected peak attendance day, which resource will reach its limit first and at what specific time? If no one on the project team can provide a quantitative answer, then you have not yet developed a true "capacity plan".
Part Ⅱ: Guest Throughput For Attractions
For attractions that dispatch guests in batches, dispatch interval and ride duration (the time spent traveling down the slide) are distinct concepts. The dispatch interval refers to the time elapsed between the departure of one group of visitors from the starting platform and the moment the next group is permitted to depart. This interval is influenced by factors such as the time required for the preceding group to clear the splash pool, the retrieval of rafts or mats, height verification at the top of the stairs, or the speed at which staff can assist visitors in boarding. The relevant formulas are as follows:
Hourly guest capacity = (3,600 ÷ dispatch interval in seconds) × the number of guests per dispatch
Daily capacity = hourly capacity × operating hours × availability factor
For example: The data provided below are for a demonstration model, intended to illustrate the calculation logic.
| Attraction | Dispatch interval | Riders per dispatch | Riders per hour | 8‑hour capacity at 85% availability |
|---|---|---|---|---|
| Single‑rider body slide | 25 s | 1 | 144 | 979 |
| Two‑rider tube slide | 40 s | 2 | 180 | 1,224 |
| Four‑person family raft | 90 s | 4 | 160 | 1,088 |
| Six‑lane mat racer | 30 s | 6 | 720 | 4,896 |
Two key insights emerge from the throughput formula. First, throughput is fundamentally constrained by the established system design. If the runout pool at the end of a glide can safely accommodate only one raft at a time, then no matter how rigorous or efficient the dispatch operations may be, they cannot overcome the limitations imposed by the pool’s clearing cycle. Second, reducing the dispatch interval can yield significant gains: shortening the dispatch interval from 30 seconds to 25 seconds increases capacity by 20%. For water parks, this is often the most cost-effective way to boost capacity.
Part Ⅲ: Designing For Peak Periods, Not Averages
Calculating the average daily attendance—by dividing the total annual visitor count by the number of operating days—rarely reflects the reality of any given operating day. Fundamentally, capacity planning is a peak load challenge. Therefore, design targets should be based on the 90th percentile of attendance during the peak season—and, more critically, must account for the peak hours within that day.
Visitor traffic at water parks is characterized by pronounced peaks. A large proportion of guests arrive within the first three hours of opening, often pushing the park to its effective saturation threshold by midday and keeping it in an overloaded and constrained state for several hours thereafter. If a facility is designed based only on average daily attendance, the park will—for much of the peak season—either have to turn guests away or struggle with unmanageable queues (or both).
Queue lengths do not increase linearly with demand. According to "Little’s Law", the average queue length is the product of the arrival rate and the average waiting time. Consider a slide with a rated capacity of 180 guests per hour: if demand reaches 400 guests per hour, a backlog of 220 guests will form every hour. After one hour, there will be approximately 220 people in line, with an estimated wait time of nearly 73 minutes. By the second hour, the queue will exceed the patience threshold of most families, causing them to abandon the attraction. This is not a genuine solution, it merely spreads dissatisfaction to a larger number of guests.
The costs of long queues extend well beyond a poor guest experience. Visitors often adjust their entire day’s itinerary to cope with the wait, such as arriving earlier, riding attractions fewer times, shifting their meal times, or even leaving the park prematurely. These behavioral shifts shorten the time guests spend in the park and suppress secondary spending—a critical revenue stream in most financial projections.
Part Ⅳ: The Equipment Configuration Determines The Capacity
A successful water park requires a balanced mix of four distinct categories of facilities. Treating all attractions as interchangeable often leads to high capital expenditures, while the resulting overall visitor capacity may end up being disappointingly low.
| Role | Typical Examples | Capacity Profile | Operational Function |
|---|---|---|---|
| Demand Generator | freefall drop tower, signature raft ride | Low throughput, high experiential value | Serving as a primary draw, these elements create shareable moments and form the core selling point of the ticket. |
| Throughput Engine | Mat racers, multi‑lane body slides | 500–700 riders per hour | Capable of rapidly dispersing crowds and reducing wait times. |
| Dwell Extender | Interactive aqua play structures, splash pads, junior play zones | Accommodates 300 to 500 people | It allows family visitors to stay for an additional two to three hours, thereby driving extra revenue in dining and retail. |
| Capacity Sink | Wave pool, lazy river | Accommodates 800 to 1200 people | Manage surges in visitor traffic during peak periods, while also allowing tourists more time to enjoy themselves and relax. |
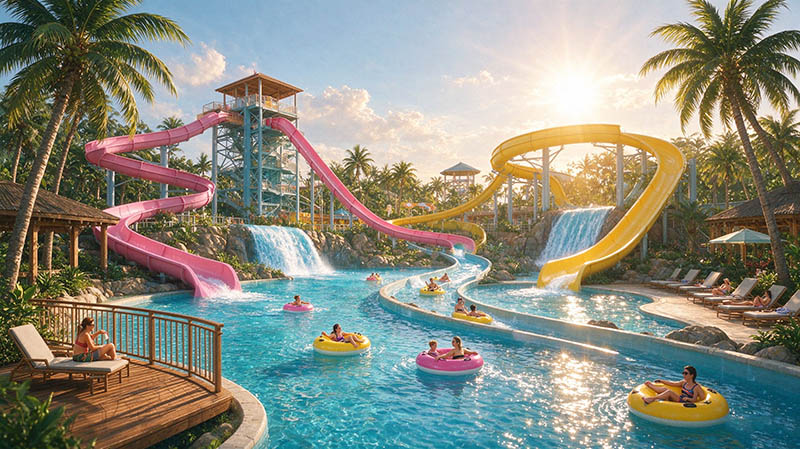
Among the various types of attractions, the capacity sinks facilities designed to absorb large numbers of guests are arguably the most underrated. Wave pools and lazy rivers, for instance, can accommodate hundreds of visitors at once with a relatively low capital investment per person, and they require virtually no formal queuing. These attractions provide a vital breathing space for water slides, helping to alleviate congestion in the areas where queues for slides typically form. Without sufficient capacity sinks, visitors tend to congregate around splash towers by midday. Conversely, well-designed capacity sinks help distribute guest traffic more evenly throughout the operating day.
Visitor flow patterns are just as critical as a park’s theoretical capacity. When visiting, guests tend to naturally follow a circular path that might include riding a slide, play in a pool, enjoying refreshments, and participating in interactive attractions. In parks with cramped spaces and limited pathways, visitors quickly exhaust all the available activities. Many families end up leaving after only 4.2 hours. By creating more diverse visitor routes—for instance, by adding wave pools, interactive attractions, and shaded rest areas—parks can extend the duration of a guest’s visit to six hours or even longer.
Key takeaway: For this reason, the most meaningful metric for gauging efficiency is not the number of visitors per hectare, but the visitor hours per hectare—that is, the total duration of paid leisure time generated by visitors within the site’s footprint each day.
Part Ⅴ: How Capacity Turns Into Revenue
Revenue equals visitor arrival volume multiplied by per capita spending. The visitor volume is constrained by a park’s capacity, while per capita spending depends on the mix of attractions offered and the duration of each visitor’s stay.
Even if two theme parks receive identical capital investment, their final profits can differ significantly. This disparity does not because of ticket prices, rather, it depends on how much time visitor spending in the water park, and how much of that time is turn into spending on food and drinks, rental services, and premium experiences. For instance:
| index (Example) | Park A: Thrill-Ride Focused | Park B: Balanced Attraction Mix |
|---|---|---|
| Attraction Investment Index | 100 | 100 |
| Throughput (Guests/Hour) | 620 | 1,180 |
| Comfortable Daily Capacity (Guests) | 2,400 | 3,300 |
| Average Dwell Duration | 4.5 hours | 6.0 hours |
| Daily Sold Guest Hours | 10,800 | 19,800 |
| Ticket Price | 32 | 32 |
| Average Secondary Spend | 12 | 16 |
| Daily Revenue | 89,800 | 134,600 |
| Quarterly Revenue (Index) | 100 | 150 |
The conclusion is not that thrill rides are poor assets. The experience at Park A can be completed in half a day, whereas Park B is designed for a full-day visit. Given the same level of capital investment, Park B generates 50% more revenue because of its ride mix, which fosters longer visitor stays rather than merely providing individual ride experiences. Extending the time visitors spend at a park creates opportunities for them to increase their overall spending within the park.
Conclusion
Capacity lies at the intersection of design, engineering, and finance. It defines the upper limit of a park’s guest capability. During the planning phase, you must consider the specific function of each attraction and identify which resources are likely to be exhausted first. By strategically laying out every ride and facility to maximize their utility, the water park can truly achieve the performance promised in its financial models.